ETH, SOL & XRP Pro Bots: 30-Day Performance Review
Our AI crypto trading bots have now been running in active operations long enough to establish a regular monthly update cadence from the Crypto Trading Platform (CTP) team.
We continue our series of monthly product updates dedicated to the best-performing AI crypto bots on the CTP platform. In this format, we focus not only on final profit, but also on the trading mechanics behind the result: ROI, PnL, commissions, matched orders, total orders, matched order rate, turnover, and balance behavior during changing market conditions.
This month, we are reviewing three bots with different market logic and different trading environments. The first one is the high-volatility Uni XRP 5% – Pro bot, which works with the XRP/FDUSD trading pair. We also take a closer look at two stable pair bots: FDUSD/USDC and USD1/USDT.
Together, these examples show how crypto trading automation can work across different market conditions: from volatile asset movement to stable pair trading with high order matching and zero commission.
The Uni XRP 5% – Pro bot showed strong performance from 1 April. According to the dashboard, the bot generated +379.74 USDT PnL and reached +19% ROI. For a high-volatility asset like XRP, this result is especially important because the crypto AI trading bot had to work through both market declines and strong upward price movements.
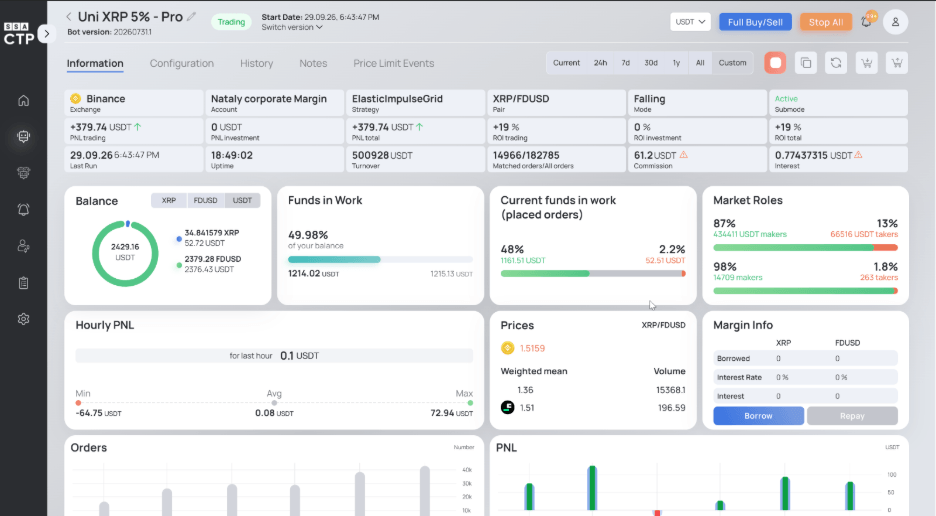
The bot placed 182,786 total orders, out of which 14,967 orders were matched. This gives a matched order rate of 8.1%, which shows how many orders were successfully matched from all orders placed by the bot. In this type of strategy, a lower matching percentage does not necessarily mean weak performance. It shows that the bot creates wide market coverage, but executes only when market conditions match the strategy logic.
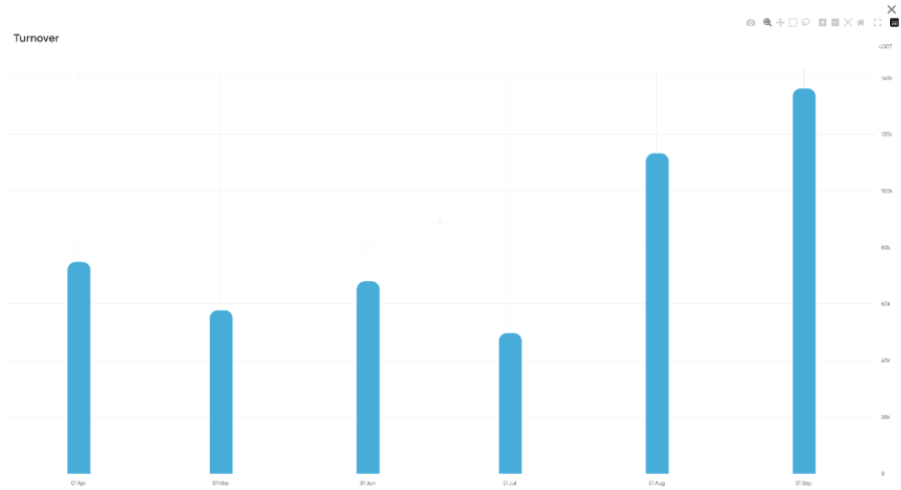
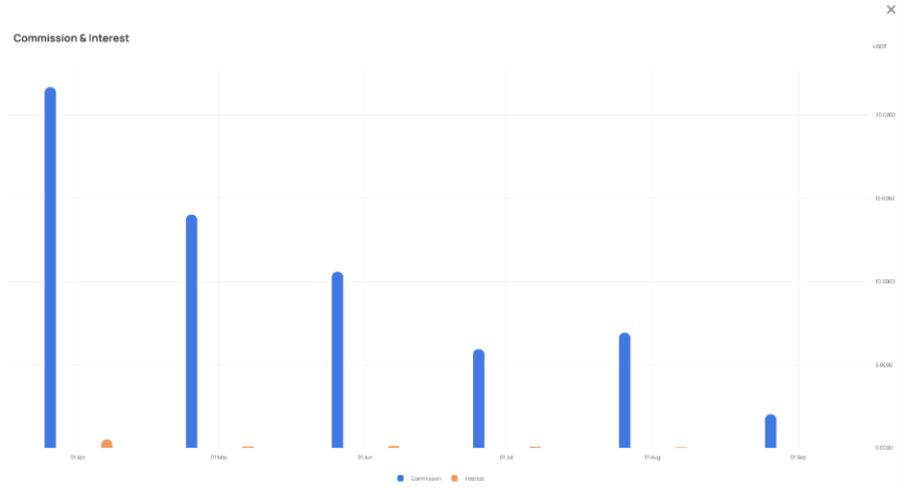
The bot’s turnover reached 500,840 USDT, reflecting absolute balance movements during active trading. Commission was 61.2 USDT, which remained controlled considering the high number of orders and the level of market activity.
| Performance indicator | Uni XRP 5% – Pro (from 1st April) |
| PNL | +379.74 USDT |
| ROI | +19 % |
| Total orders | 182,786 |
| Matched orders | 14,967 (8.1%) |
| Turnover | 500,840 USDT |
| Commission | 61.2 USDT |
| Trading pair | XRP/FDUSD |
| Exchange | Binance |
The bot was working in Falling mode at the moment of review. We covered standard and falling modes in more detail in previous product updates, so here the key point is how this mode supported real trading performance. Falling mode helps the AI bot for crypto trading remain active during downward price movement instead of simply waiting for recovery.
The Balance vs Price chart shows that the bot was able to protect and increase the balance over the reviewed period. Even when the XRP price moved down and then recovered, the balance bars continued to show positive progress toward the end of the period. This is one of the core benefits of the strategy: the bot is designed not only to trade market growth, but also to preserve balance while the price is falling.
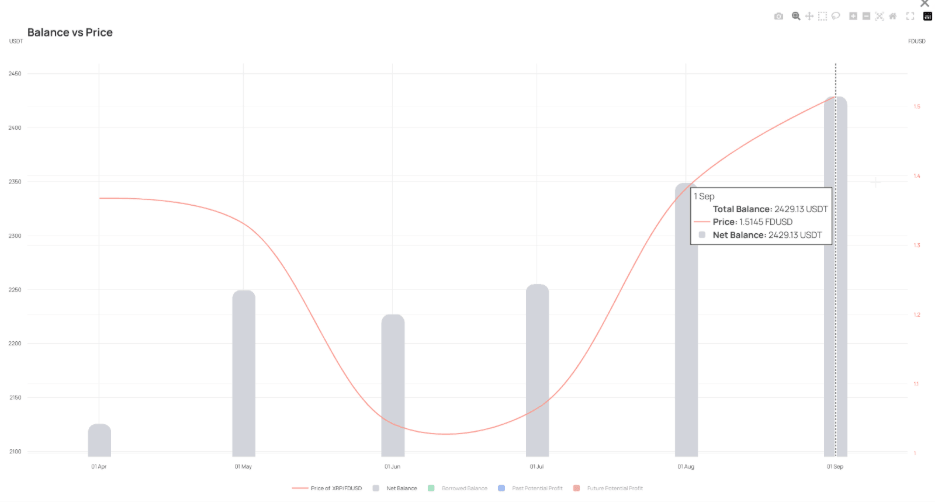
The balance dynamics were also supported by the loan strategy applied during downtrends. We have already described the logic behind this strategy in earlier product updates, so here it is worth highlighting the outcome: it helped the bot stay active in a falling market and protect the balance from sharper drawdowns.
The market mode chart for the XRP Pro bot shows several active trading phases across the reviewed period. The blue areas reflect standard mode, while the pink areas reflect falling mode. The red line shows PnL behavior.
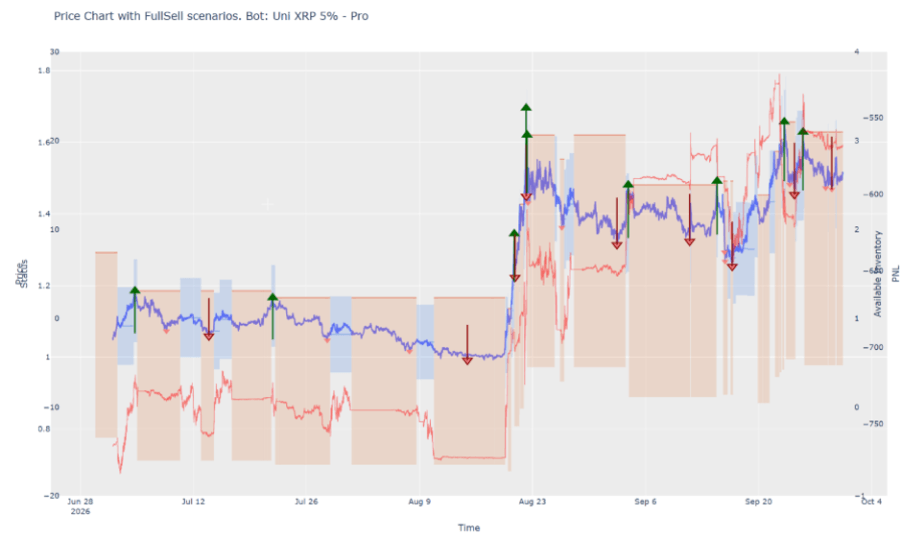
The chart shows that the bot moved between modes as the market changed. During lower or declining price phases, falling mode became more visible. When the market recovered and XRP started moving upward again, the bot continued to capture trading opportunities and convert volatility into PnL growth.
This is important for AI crypto bot performance because volatility can create both risk and opportunity. The XRP Pro bot was able to use both sides of the market: it protected balance during weaker phases and generated stronger PnL during market acceleration.
The cumulative PnL chart shows a positive overall curve. There were some smaller corrections during the period, which is expected for a high-volatility AI trading bot crypto strategy, but the general direction remained upward.
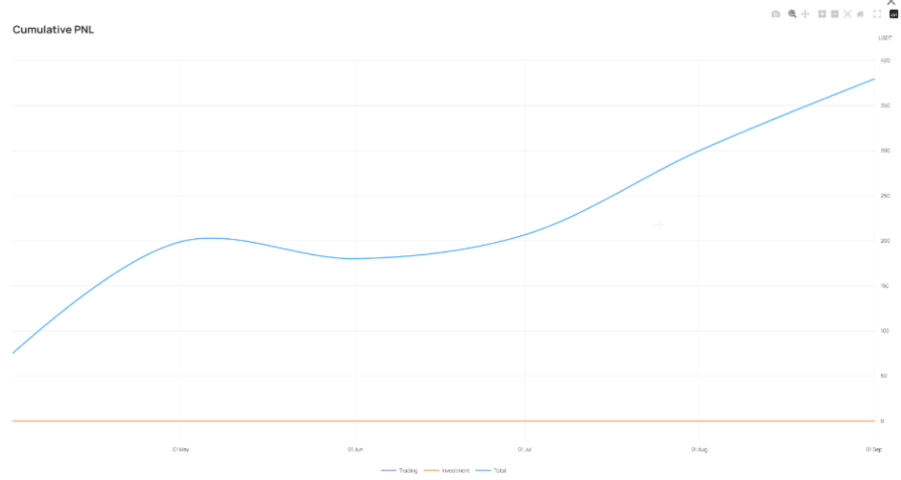
The strongest growth phase appeared after the market recovery, when XRP volatility increased and the bot had more opportunities to match profitable orders. By the end of the reviewed period, the bot reached +379.74 USDT PnL, confirming the final dashboard result.
The PnL structure is important because the result was not based on one isolated trading spike. The bot continued to work across different market phases and gradually built the final result through active order execution, mode switching, and controlled balance management.
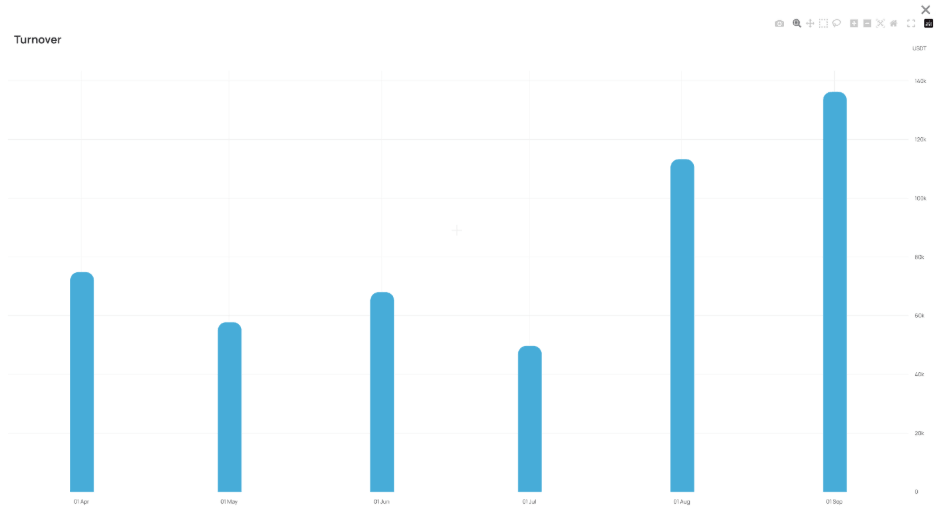
The turnover chart shows that the XRP Pro bot maintained regular trading activity throughout the period, with stronger turnover days during more active market phases. Total turnover reached 500,840 USDT, showing that the bot actively reused the available balance and did not keep funds idle.
The commission chart shows that trading costs remained under control. For a bot that placed more than 180,000 orders, commission efficiency is an important metric. It directly affects the final PnL, especially when the strategy relies on frequent order placement and execution.
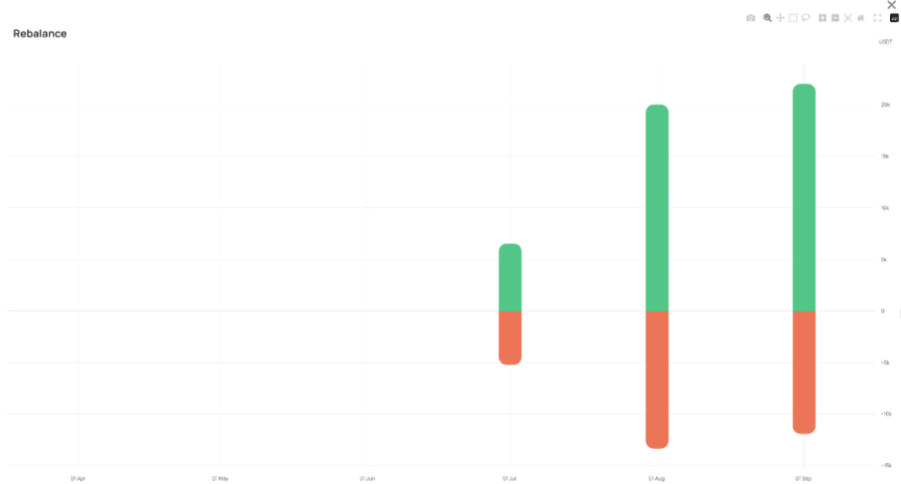
The rebalance chart shows how the bot adjusted assets during the trading period. These movements helped the strategy stay aligned with changing price conditions and supported the bot’s ability to continue working during volatile phases.
The FDUSD/USDC stable pair bot was reviewed for a longer period starting from 1 April. This bot works differently from the XRP Pro bot because it operates in a stable pair environment, where price movement is usually much narrower.
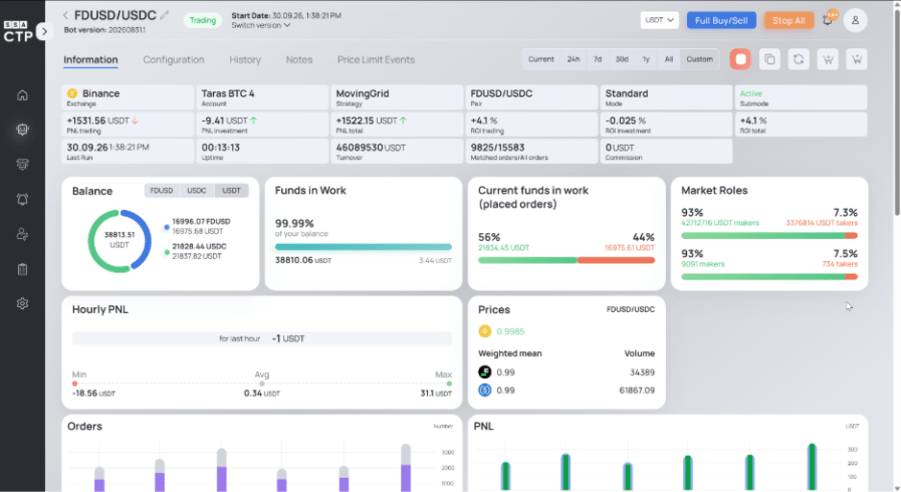
Despite lower volatility, the bot generated +1,524.32 USDT PnL and reached +4.1% ROI. The bot placed 15,587 total orders, with 9,829 matched orders, giving a matched order rate of 63%. This is much higher than the XRP Pro bot because stable pair crypto robot trading strategies usually work with tighter price corridors and more frequent matching opportunities.
The most impressive metric is turnover. The FDUSD/USDC bot reached 46,103,845 USDT turnover, while commission remained 0 USDT. This shows a highly efficient stable pair trading model where the bot generated large trading volume without commission pressure.
| Performance indicator | FDUSD/USDC (from 1st April) – 6 months |
| PNL | +1524.32 USDT |
| ROI | +4.1 % |
| Total orders | 15587 |
| Matched orders | 9829 (63%) |
| Turnover | 46,103,845 USDT |
| Commission | 0 USDT |
| Trading pair | FDUSD/USDC |
| Exchange | Binance |
The dashboard card shows the bot working in Standard mode, which is expected for a stable pair strategy. In this case, the bot does not need to react to large price drops in the same way as a high-volatility asset bot. Instead, it focuses on maintaining consistent trading activity inside a narrow price range.
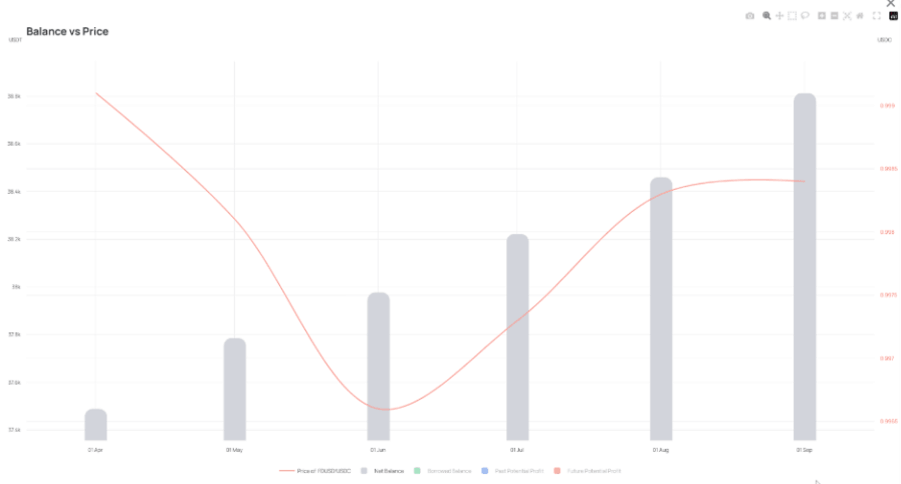
The balance chart shows gradual balance growth while the price line moves within a limited range. This is exactly what we expect from a stable pair bot: the goal is not to catch large market surges, but to generate consistent results through repeated, controlled trading cycles.
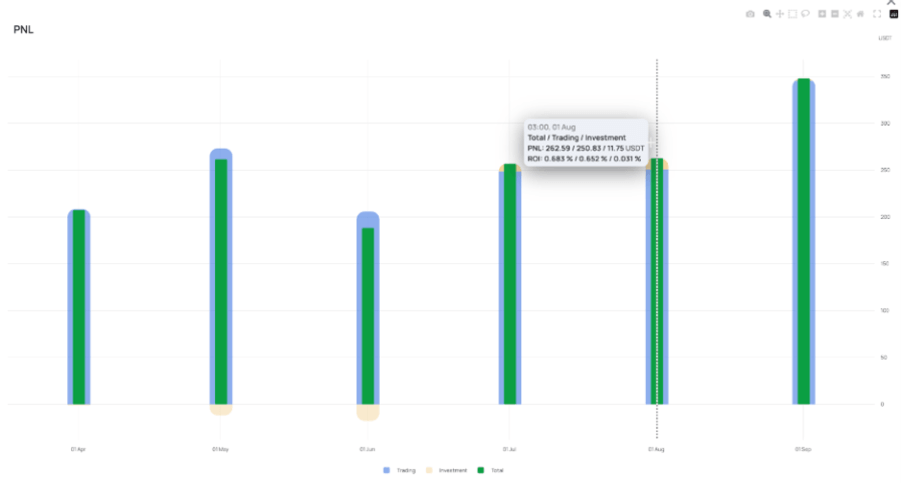
The FDUSD/USDC PnL chart shows regular positive daily results. The cumulative PnL line moves steadily upward, which reflects the nature of stable pair trading. Instead of sharp profit jumps, the bot builds performance step by step.
The turnover chart also confirms stable activity across the period. Some days show higher turnover, but the general pattern is consistent. This means the bot was able to keep using the allocated balance efficiently and repeatedly.
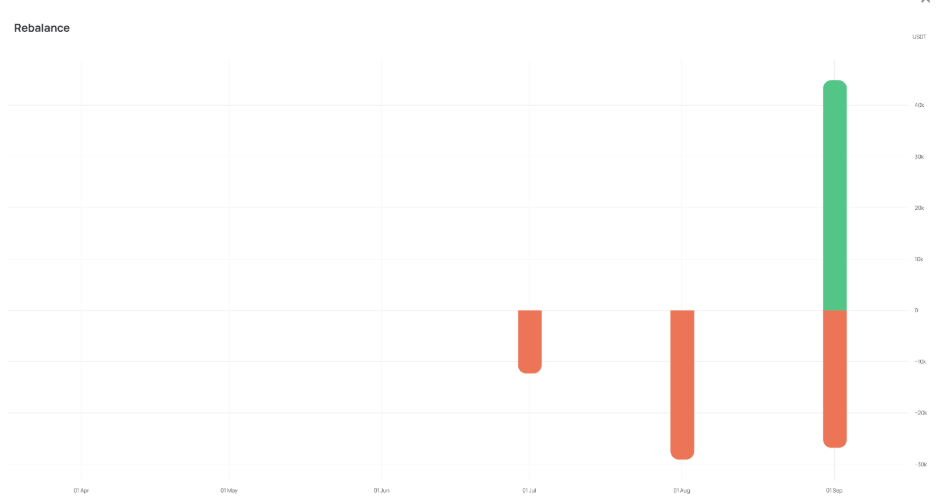
The rebalance chart shows regular positive and negative adjustments, which helped maintain the correct asset structure between FDUSD and USDC. For stable pair strategies, rebalancing is essential because it keeps the bot ready for the next cycle of matched orders.
The USD1/USDT bot was reviewed for the period starting from 1 September. Even within one month, the bot showed strong trading activity and generated +575.85 USDT PnL with +0.847% ROI.
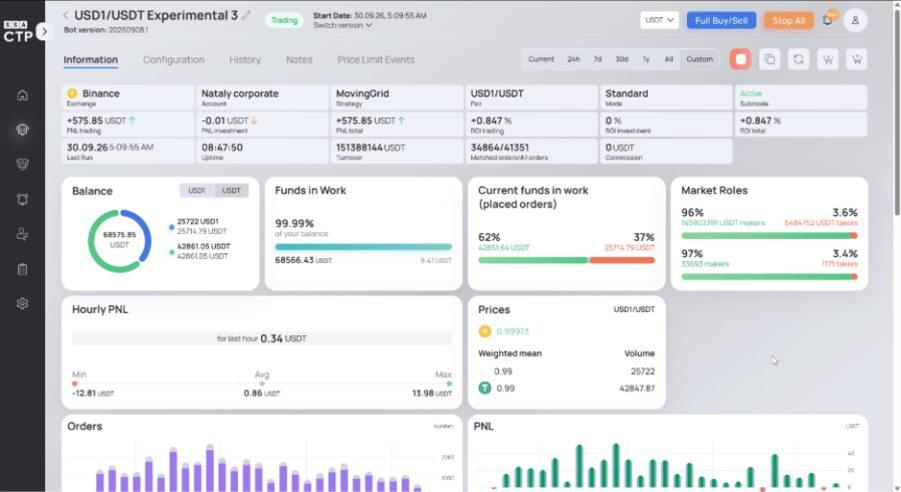
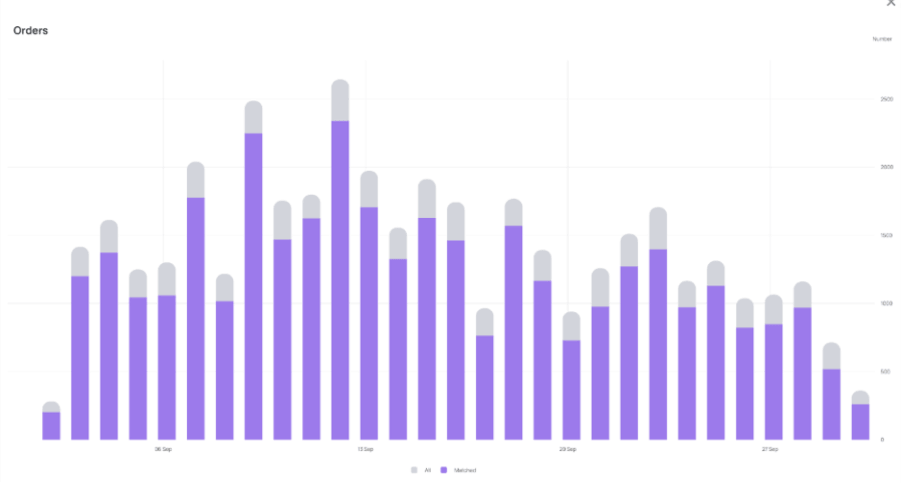
The bot placed 41,351 total orders, and 34,864 orders were matched. This gives a matched order rate of 84.3%, which is the highest among the bots reviewed in this update. It shows that the USD1/USDT strategy had very strong order execution efficiency during the period.
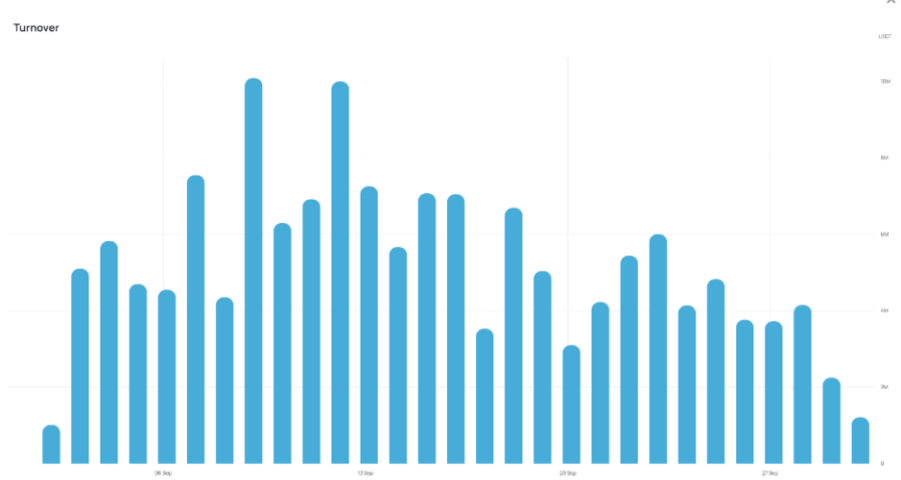
Turnover reached 151,388,144 USDT, while commission stayed at 0 USDT. This combination of high turnover, high matched order rate, and zero commission makes the bot a strong example of efficient stable pair crypto trading automation.
| Performance indicator | USD1/USDT (from 1st September) – 1 month |
| PNL | +575.85 USDT |
| ROI | +0.847 % |
| Total orders | 41,351 |
| Matched orders | 34,864 (84.3%) |
| Turnover | 151,388,144 USDT |
| Commission | 0 USDT |
| Trading pair | USD1/USDT |
| Exchange | Binance |
The dashboard card shows the bot operating in Standard mode. For this type of pair, standard mode is focused on repeated execution, high matching efficiency, and constant use of balance within a controlled price corridor.
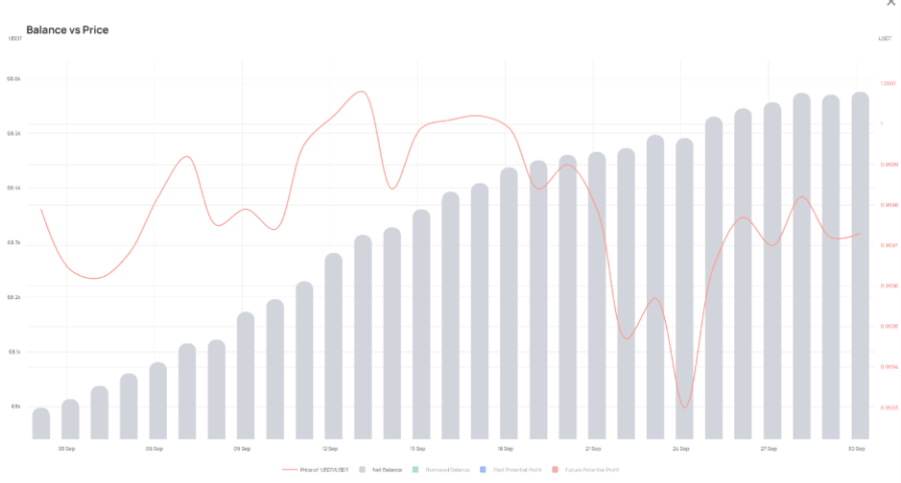
The balance chart shows a clear upward movement over the reviewed period. Even though the price line changed during the month, the balance bars continued to grow. This confirms that the bot was able to use stable pair price movement efficiently and build a positive result through repeated trading cycles.
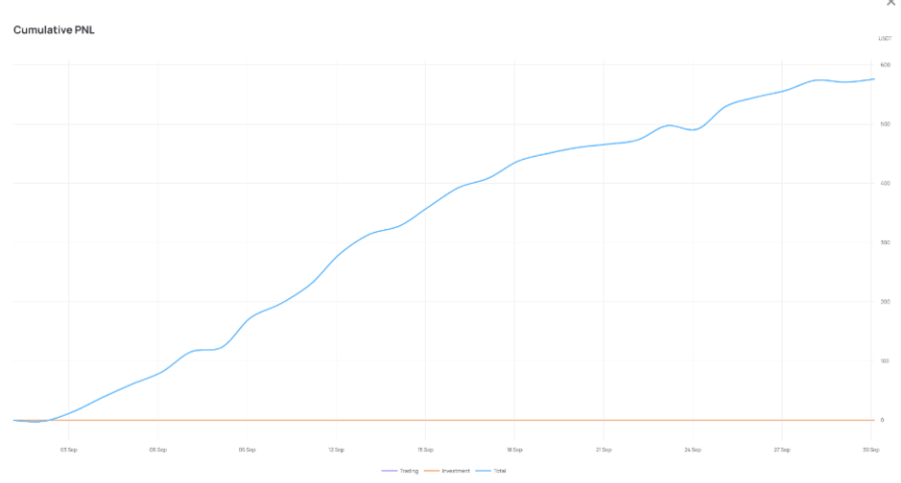
The cumulative PnL chart for USD1/USDT shows steady growth throughout the reviewed month. The curve rises consistently, with only minor pauses, which reflects stable performance and strong order execution.
The orders chart also shows high daily activity. The purple bars represent matched orders, while the grey part shows total orders. The large share of matched orders visually supports the 84.3% matched order rate shown in the performance table.
This is a key difference between volatile bots and stable pair bots. With XRP, the bot needs broader order placement and more selective execution. With USD1/USDT, the bot can match a much larger share of orders because the market conditions are more stable and predictable.
This update shows three different examples of AI crypto bot performance.
The Uni XRP 5% – Pro bot delivered the highest ROI among the reviewed bots, reaching +19%. It worked with high volatility, used falling mode during downtrends, preserved balance during weaker market phases, and captured profit during market recovery.
The FDUSD/USDC bot showed how stable pair trading can generate consistent results over a longer period. It reached +1,524.32 USDT PnL, maintained a 63% matched order rate, and achieved more than 46 million USDT turnover with zero commission.
The USD1/USDT bot showed strong one-month execution efficiency. It reached an 84.3% matched order rate, generated +575.85 USDT PnL, and produced more than 151 million USDT turnover with zero commission.
Together, these results show that a well-designed crypto AI trading bot is not only about profit. It is also about how the strategy uses balance, how many orders it matches, how it controls commissions, how it adapts to market modes, and how it performs under different price conditions.
Visit ctbots.ai and SSA CTP to explore how our crypto trading bot development services and crypto trading automation solutions can help transform your trading goals into a practical system.
Already have a strategy in mind? Our crypto trading bot developers can help refine the concept, model its logic, test different scenarios, and evaluate its performance with a professional crypto trading simulator before deployment. By combining crypto simulation with structured validation, you can develop a more reliable, data-driven trading system designed for real market conditions.
Our AI crypto trading bots have now been running in active operations long enough to establish a regular monthly update cadence from the Crypto Trading Platform (CTP) team.
Since moving into active operations mode with AI crypto bots in March 2026, we are now returning with a refreshed monthly update format.
you're currently offline