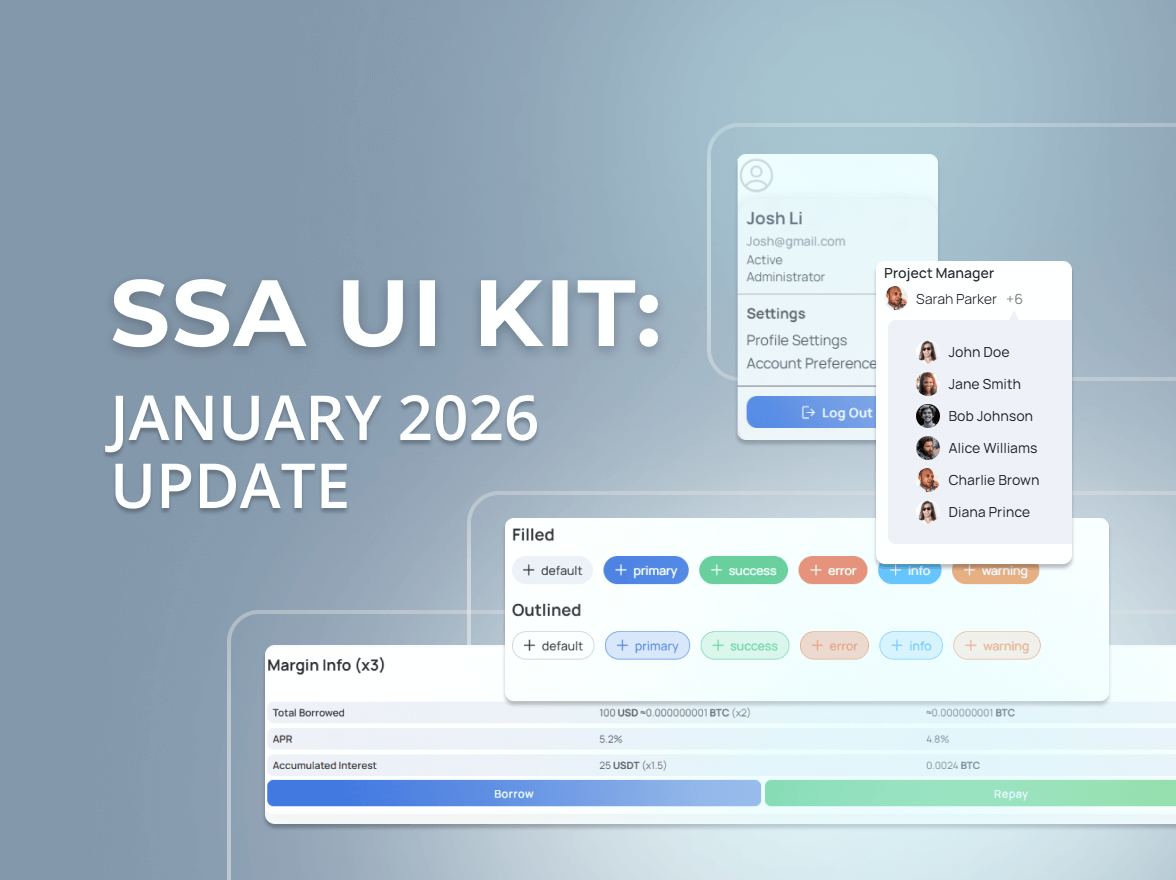
SSA UI Kit: January 2026 Update
We continue to actively evolve SSA UI kit, our React-based component library for building complex dashboards and data-driven interfaces faster and more efficiently.
What if your entire company’s infrastructure across cloud, on-premises, and every monitoring system in between, could be visualized in one dashboard? No more jumping between monitoring data provider, custom scripts, or vendor-specific tools. With SSA UI kit, we’ve built a foundation for unifying observability across all environments, enabled by two new components: Dashboard Editor and Dashboard Viewer.
These components provide the foundation for a unified, fully configurable, and cloud/ on-premises monitoring dashboard experience—capable of aggregating data from virtually any infrastructure monitoring source.
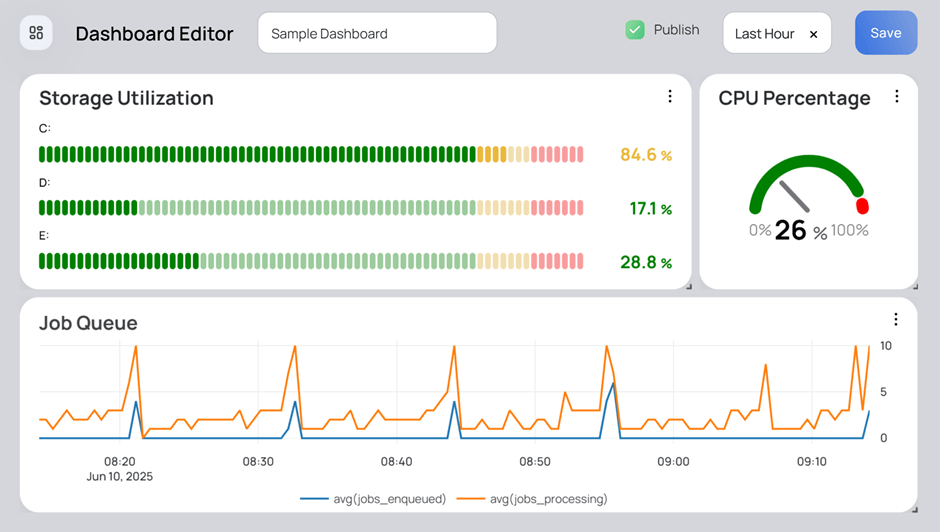
The Dashboard Editor is an intuitive, React-based component that allows users to build and customize monitoring dashboards. Using this editor, you can:
The interface supports real-time preview and layout updates, letting users quickly compose dashboards tailored to specific monitoring needs.
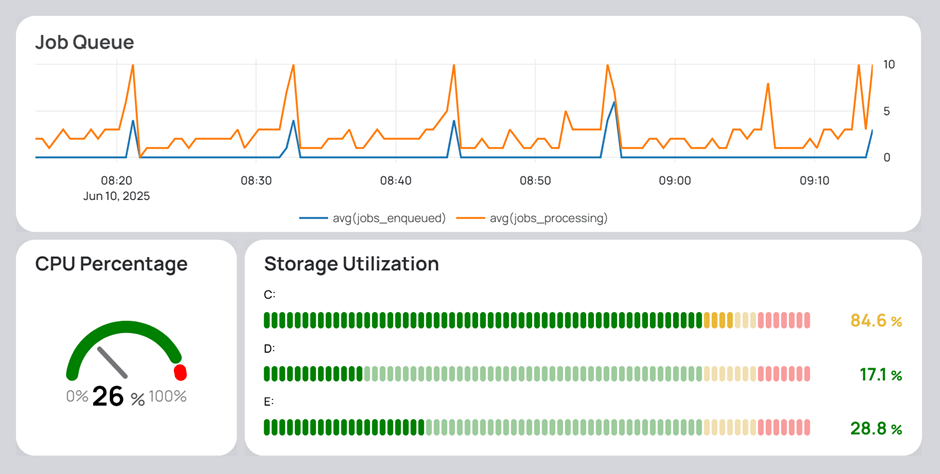
Once a dashboard is defined, Dashboard Viewer renders the live view, populated with monitoring data. It supports:
All visuals are pulled from underlying infrastructure data sources and presented in a user-friendly, responsive layout.
At the heart of this system lies a flexible architecture that supports any infrastructure monitoring provider.
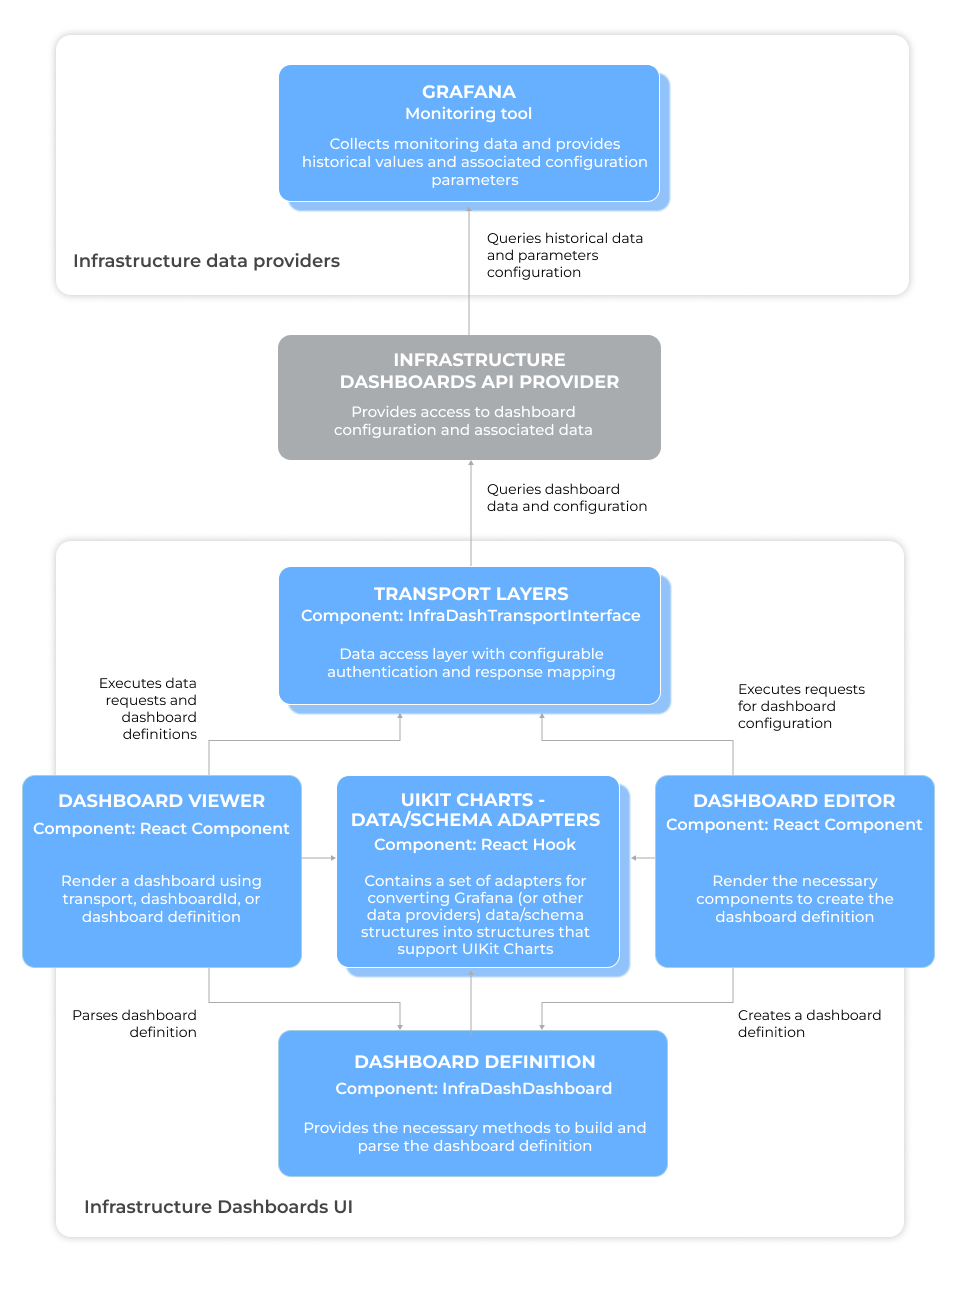
While we currently showcase Grafana as the data provider in the architecture diagram, the system is fully data-agnostic. It can support multiple monitoring providers simultaneously, whether your infrastructure is on-premises, cloud-based, or hybrid. Regardless of the number or type of systems, technologies, or monitoring tools in place—our solution brings everything together into a single, unified dashboard.
Here’s how the architecture works:
With the new SSA UI kit components, your team can:
With Dashboard Editor and Dashboard Viewer, you are no longer limited by tool-specific dashboards or disconnected data views. Whether you monitor Kubernetes clusters, on-prem VMs, or cloud-native apps, SSA UI kit lets you orchestrate everything into a single, cohesive interface.
Looking to build a powerful, unified monitoring dashboard? With SSA UI kit, we offer not just the tools but the expertise to help you implement them. Whether you need custom components, tailored integrations, or end-to-end dashboard development, we are here to help you.
Have feedback or want to collaborate on new components? Get in touch with us, we’d love to hear from you!
We continue to actively evolve SSA UI kit, our React-based component library for building complex dashboards and data-driven interfaces faster and more efficiently.
AI is changing how digital products are built. Instead of manually crafting every interface, we are entering a new era where intelligent systems like ChatGPT can generate dashboards, and admin panels automatically.
you're currently offline